

First-time buyers: Fargo–Moorhead vs. the country
30% of our 2026 home inspections were for first-time buyers (34% in 2025). Nationally, first-time buyers fell to a record-low 21%, and their median age hit 40. (NAR, Nov 2025)
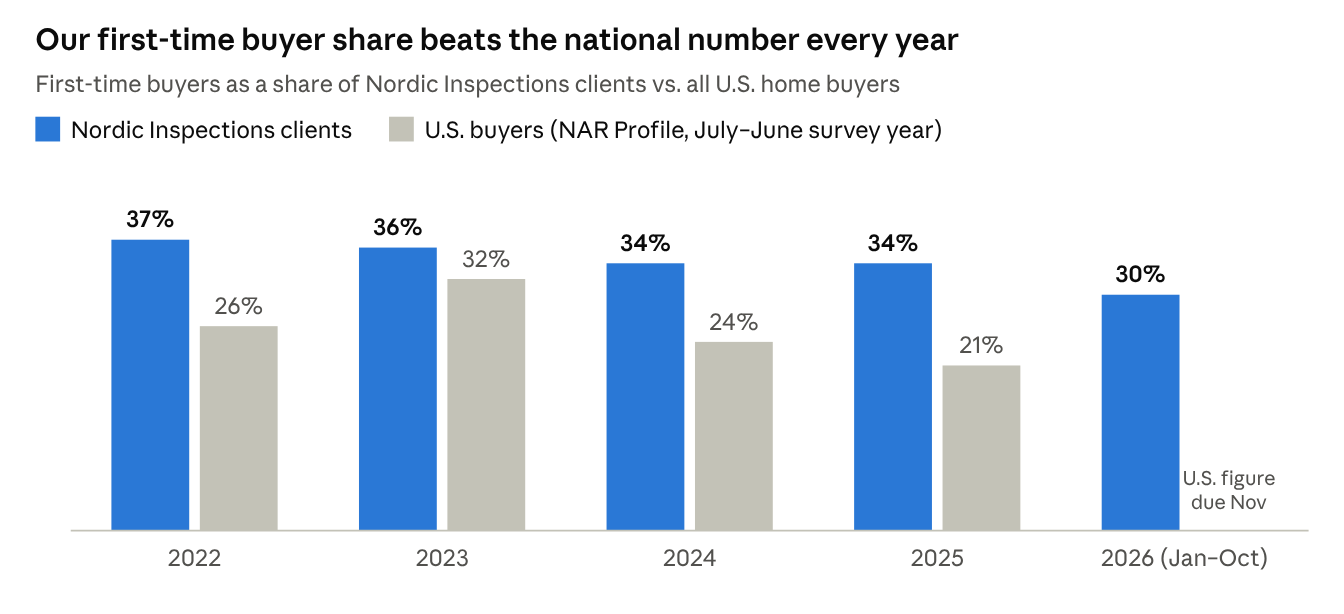
Our share has eased down from 37% in 2022, but this is still a market where young buyers can get in the door. That’s a lot of first walk-throughs, first furnaces and first questions about what a sump pump does.
So why are first-time buyers so much stronger here? Is it price? Starter homes in Fargo sold for about $236,000 in January, vs. $260,000 nationally, while local incomes sit close to the national average (Redfin via Stacker). Is it all the renters ready to make the jump? Only 55% of metro households own their home, vs. 65% nationally (Data USA). Or is it programs like North Dakota’s FirstHome, which helped 1,739 first-time buyers last year (NDHFA)? We’d love to hear what you think.
Radon: nearly 3,100 tests, mapped
Since 2011 we’ve logged nearly 3,100 residential radon tests across the valley, including more than 1,400 in Fargo and about 600 each in West Fargo and Moorhead. We believe it’s the largest radon data set in North Dakota, and it tells a clear story.
54% of the homes we’ve radon tested came in at or above 4.0 pCi/L, the level where the EPA recommends fixing the home. (EPA)
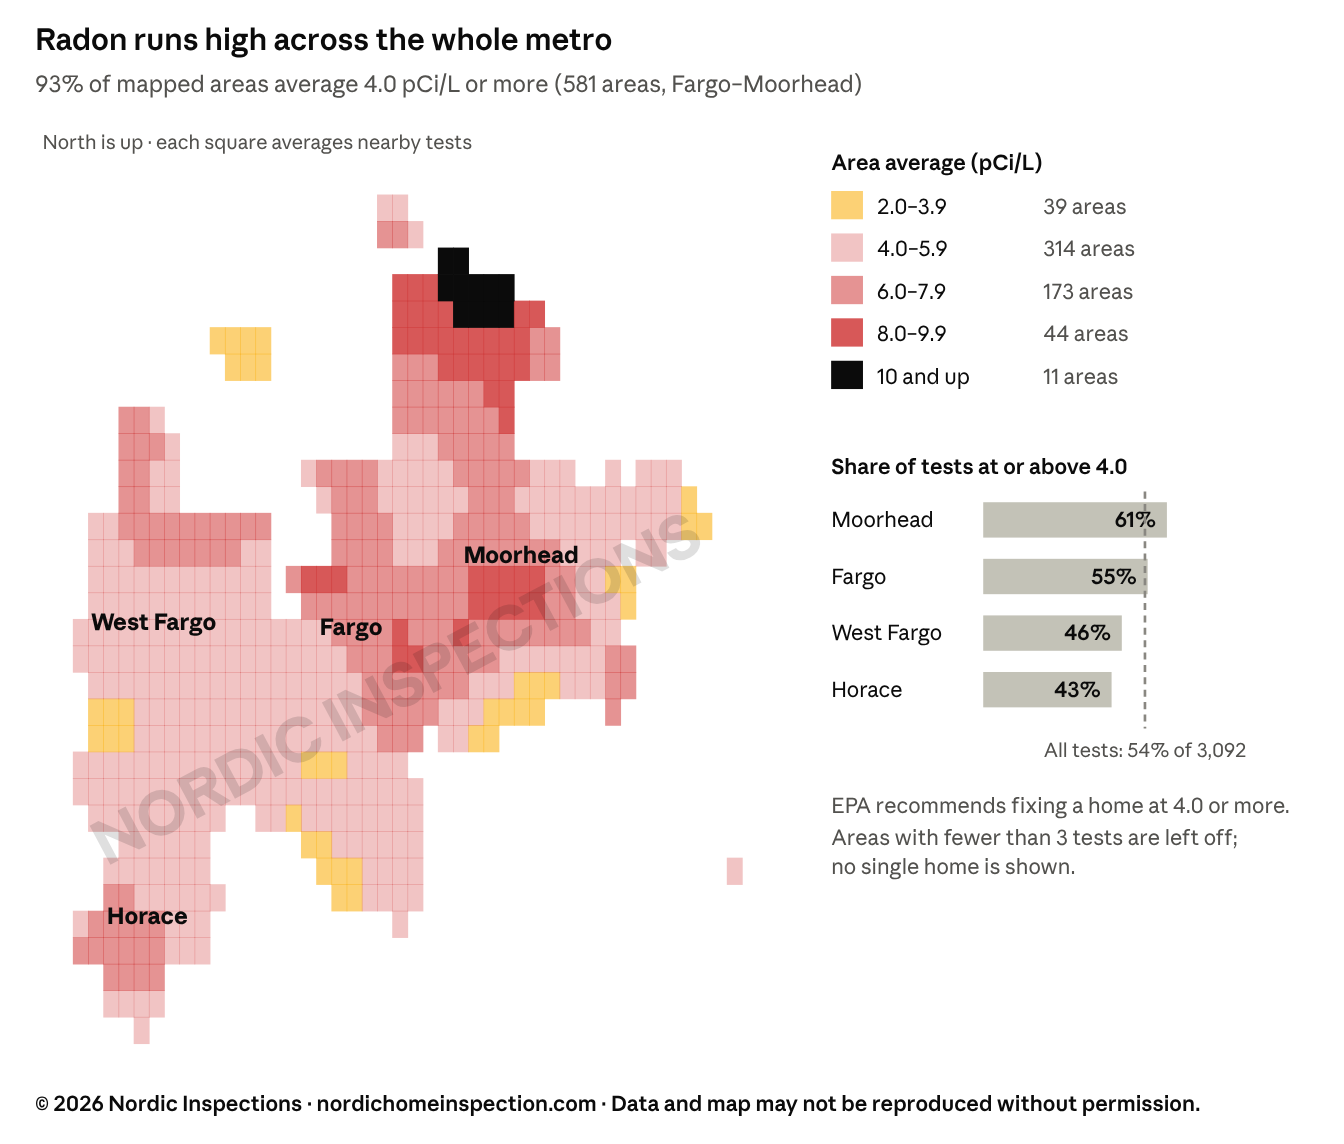
It isn’t one bad year. Every year since 2019 has landed between 49% and 58%. Winter tests run a little higher: 58% at or above 4.0 from November to March, vs. 50% in summer.
What the map can do for you: we’ve turned every result into neighborhood averages. Send us an address and we’ll tell you how that area tends to test. Just remember that radon changes house to house, so the neighbor’s result never replaces a test of the home itself.
When the market moves
From March through August we average about 85–95 home inspections a month, peaking in June. January runs at about half that pace.
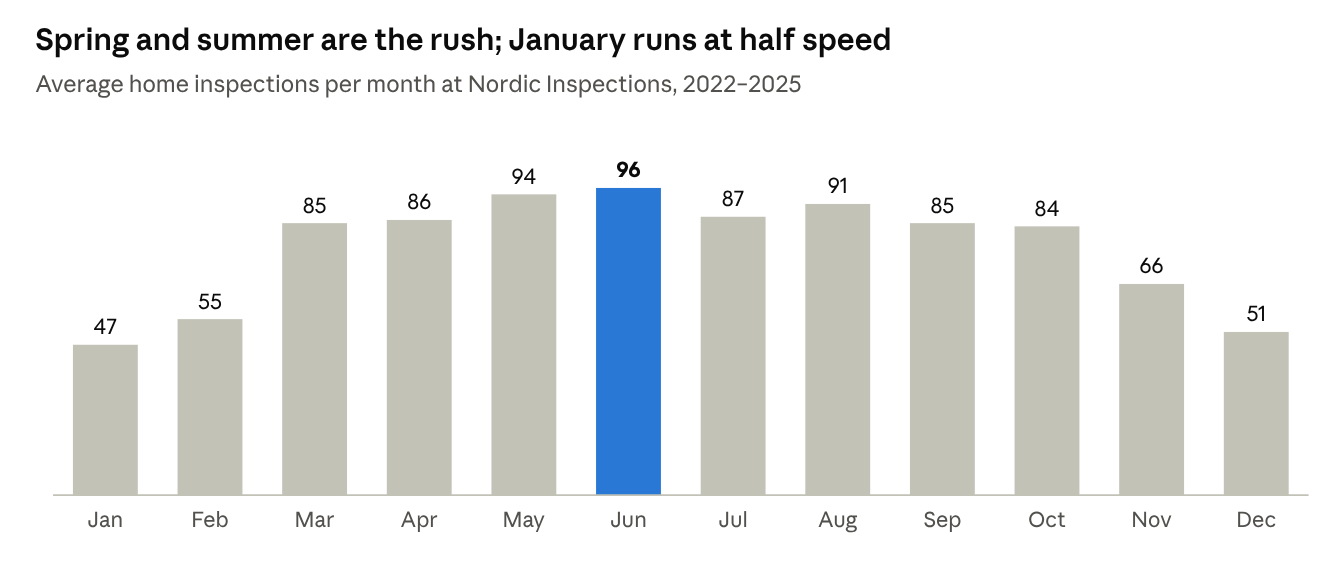
Tuesday and Wednesday are our busiest days, and Saturdays are rare. If your inspection window opens in May or June, call us the day the offer is accepted.
FSBO deals still get inspected
No listing agent doesn’t mean no agent: about half the FSBO buyers we inspected for still had a buyer’s agent working for them.
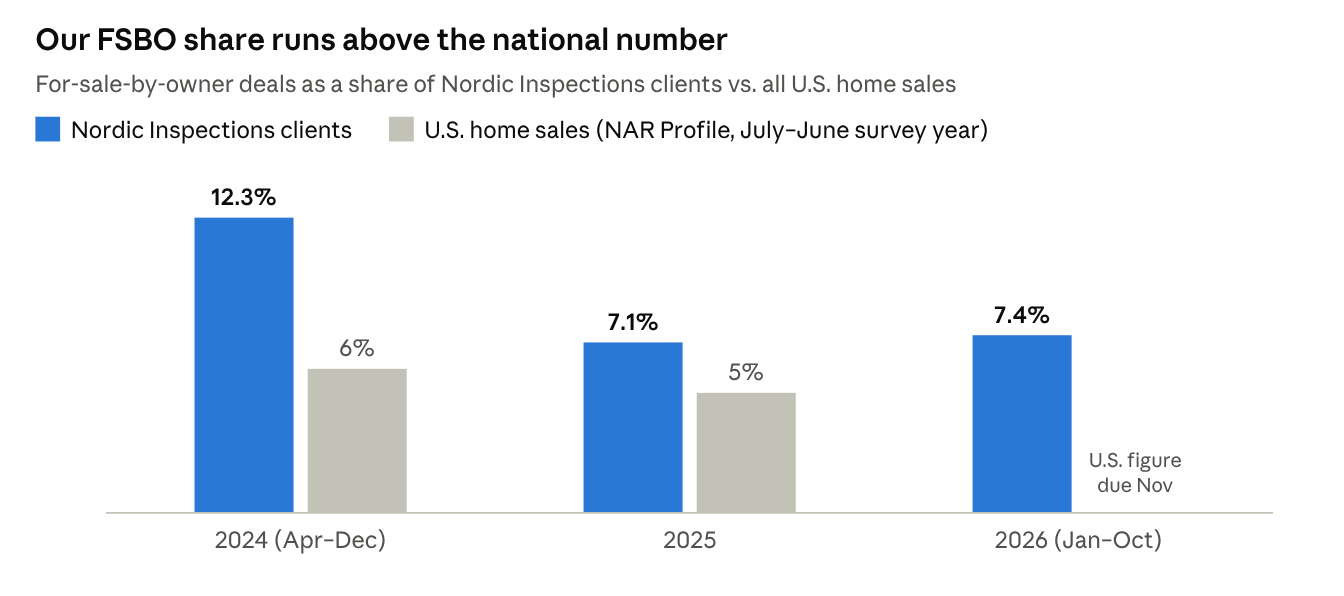
National FSBO share: 2024 Profile via Atlanta Agent, NAR, Nov 2025.
Who shows up
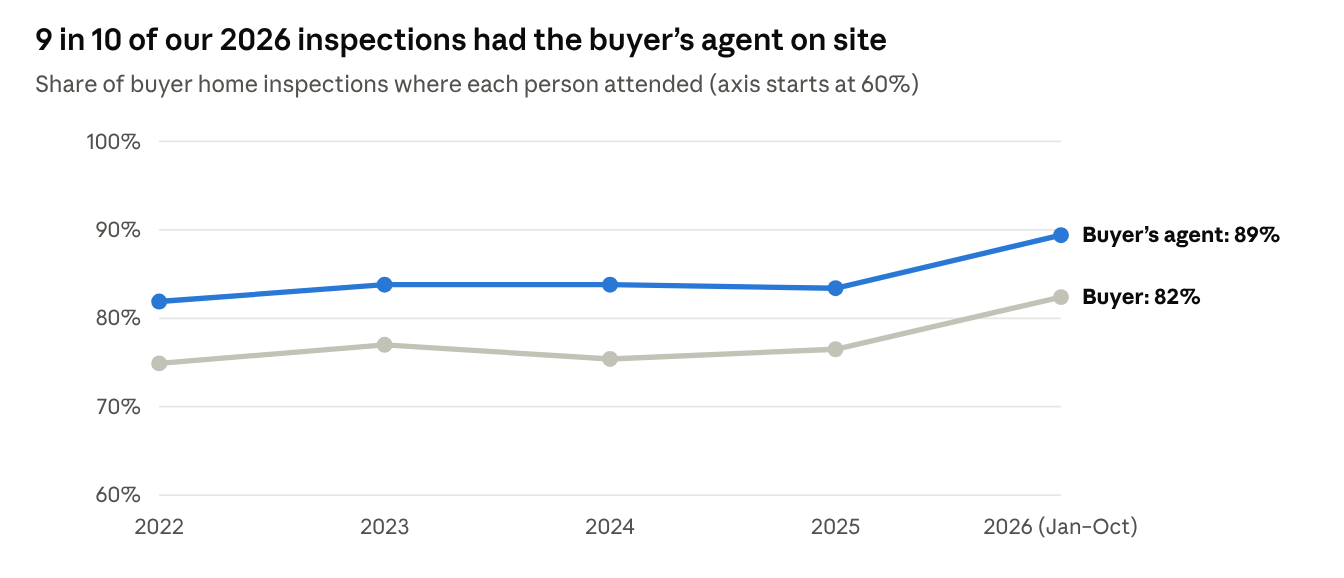
Buyer’s agents were at 89% of our 2026 home inspections, up from about 83% each of the four years before. Buyers came to 82%.
We count anyone who showed up, whether they stayed for the whole inspection or stopped by for five minutes.
Thank you. When the agent is there for the wrap-up walk-through, the buyer hears the same thing they do, and the repair conversation usually goes smoother for everyone.
Sewer scopes: older homes, older pipes
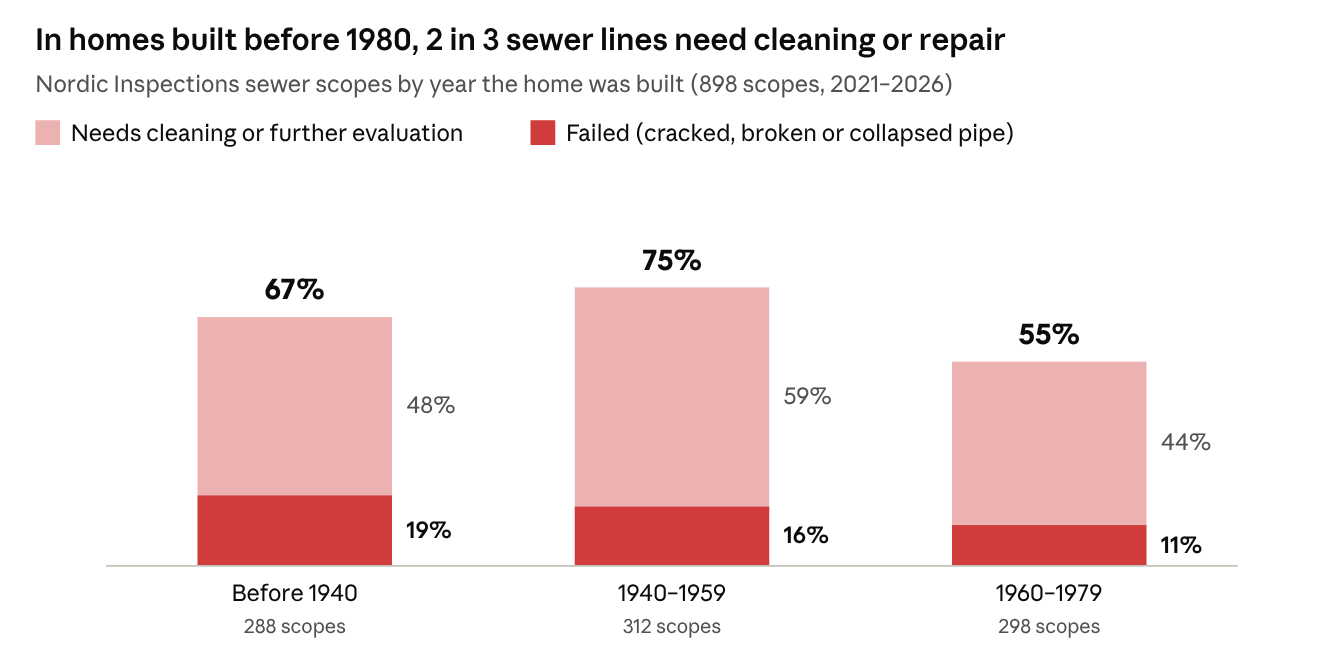
In homes built before 1980, about 2 in 3 sewer lines we scoped needed cleaning or repair, and about 1 in 7 had already failed. The worst decades: homes built from 1940 to 1959, where 75% needed work.
The neighborhoods with the highest failure rates (20 or more scopes):
| Neighborhood | Scopes | Failed | Needed cleaning or repair |
|---|---|---|---|
| Lewis & Clark, Fargo | 31 | 23% | 81% |
| Washington, Fargo | 34 | 21% | 68% |
| Horace Mann, Fargo | 68 | 19% | 60% |
A sewer line replacement can run into the tens of thousands. On a home built before 1980, a sewer scope is cheap insurance before the offer is final.
Have a question about the numbers?
If you want a number we didn’t cover here, ask. We probably have it. Call us at 701-566-1446 or book an inspection online.